.svg)

Getting started with Super AI Data Story Co-Pilot
Roadmap and resources to help you plan and excel at your careers in Data. Links for projects and jobs for data roles.
Congratulations, you have reached in a coveted society of datastory tellers. AI Co-Pilot for top 1% analysts AI. We are paving way for innovation in Data Science with generative AI.
The easiest way to do EDA without writing a single query. So, hold on to your heart on this ride, you are about to become the most endearing prompt engineer starting now.
Here is what you should look forward to
- Easiest way to perform EDA
- Use AI to Generate DataStories
- Generate insights and prescriptive analytics with AI
- Make and share data story slides
- Train AI with your human insights
Essentially you will be developing your own tiny enterprise AI brain. Before Loging into Super AI have a quick look at this step-by-step guide here and saddle up.
Step 1: Use this link to login into your Super AI Demo Account.
Login using gmail, LinkedIn or Microsoft credentials. It should be fairly simple like any single point authentication system.
Step 2: Quick Start to generate with AI
In the paid version you can Upload your Dataset, but for quick start you can work with the existing superstore dataset to get hang of things before moving on to the next level. You will see this scree as a start point. This is the AI assistant where you can pick you preference and click on CREATE DATA STORY to see the magic.
Go on try it. 😊
Note: First, you can identify the date column and pick Time Period, then pick a few metrics that you would like to see insights for and dimensions to view drill downs.
Step 3: Now sit back as the magic unfolds.
Super AI is generating a data story for you.
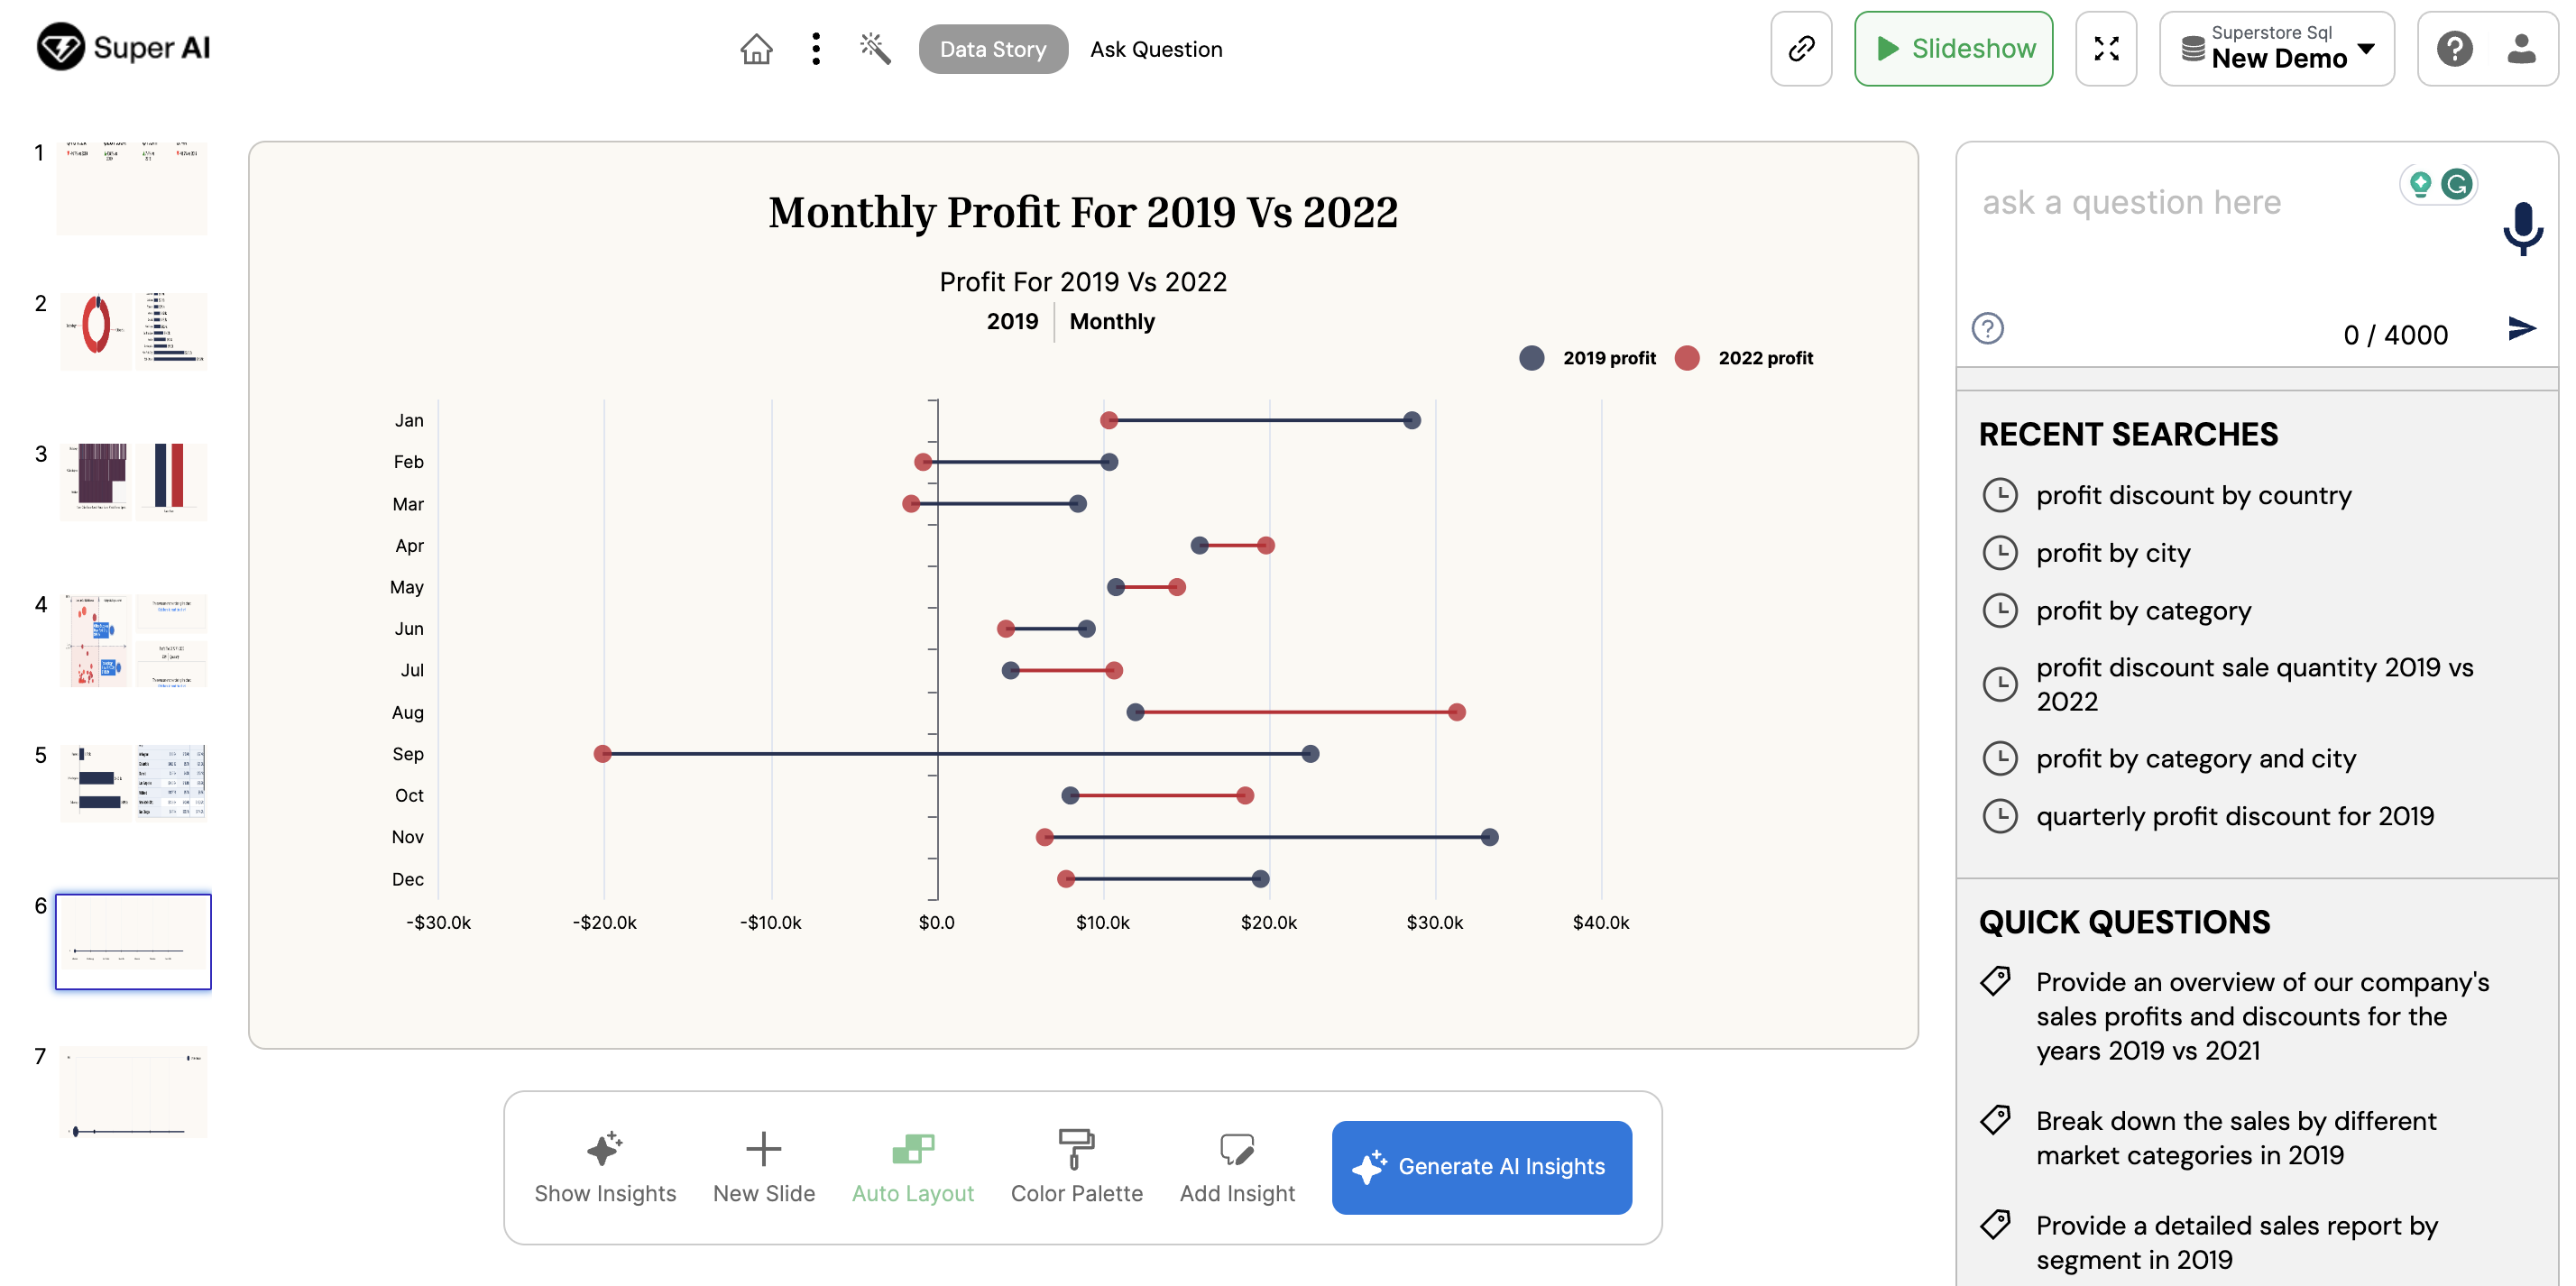
Step 4: Your first AI Generated Data Story.
Do you see multiple slides here, this is your AI Generated Data Story. Now take a minute to see the panel on right that says ask question. that's where you will be asking your new questions. But first...

Step 5: Generate AI Insights
from the data to get a better understanding of the results. Voila! Now you have the Story, the Insight and prescriptive analytics. Try going through each slide and read the insights to understand what it says.
Step 6: Run the slide show
You can click the button on top right corner of your screen that shys 'Slideshow' turn you data story in a presentation with all the insights and prescriptive actions with each chart. Isn't this amazing? and it took you may be 3 mins to get here. Now scroll through all the slides and see how well everything came together.